Problem Statement

This tutorial takes a practical and coding-focused approach. We'll learn gradient boosting by applying it to a real-world dataset from the Rossmann Store Sales competition on Kaggle:

Rossmann operates over 3,000 drug stores in 7 European countries. Currently, Rossmann store managers are tasked with predicting their daily sales for up to six weeks in advance. Store sales are influenced by many factors, including promotions, competition, school and state holidays, seasonality, and locality.

With thousands of individual managers predicting sales based on their unique circumstances, the accuracy of results can be quite varied. You are provided with historical sales data for 1,115 Rossmann stores. The task is to forecast the "Sales" column for the test set. Note that some stores in the dataset were temporarily closed for refurbishment.

View and download the data here: https://www.kaggle.com/c/rossmann-store-sales/data

Download Data

import os
import opendatasets as od
import pandas as pd
pd.set_option("display.max_columns", 120)
pd.set_option("display.max_rows", 120)
od.download('https://www.kaggle.com/c/rossmann-store-sales')
Skipping, found downloaded files in "./rossmann-store-sales" (use force=True to force download)
data_dir = os.listdir('rossmann-store-sales/')
data_dir
['sample_submission.csv', 'store.csv', 'test.csv', 'train.csv']
ross_df = pd.read_csv('./rossmann-store-sales/train.csv', low_memory=False)
test_df = pd.read_csv('./rossmann-store-sales/test.csv')
store_df = pd.read_csv('./rossmann-store-sales/store.csv')
submission_df = pd.read_csv('./rossmann-store-sales/sample_submission.csv')
ross_df
Store DayOfWeek Date Sales Customers Open Promo StateHoliday SchoolHoliday
0 1 5 2015-07-31 5263 555 1 1 0 1
1 2 5 2015-07-31 6064 625 1 1 0 1
2 3 5 2015-07-31 8314 821 1 1 0 1
3 4 5 2015-07-31 13995 1498 1 1 0 1
4 5 5 2015-07-31 4822 559 1 1 0 1
... ... ... ... ... ... ... ... ... ...
1017204 1111 2 2013-01-01 0 0 0 0 a 1
1017205 1112 2 2013-01-01 0 0 0 0 a 1
1017206 1113 2 2013-01-01 0 0 0 0 a 1
1017207 1114 2 2013-01-01 0 0 0 0 a 1
1017208 1115 2 2013-01-01 0 0 0 0 a 1

1017209 rows × 9 columns

test_df
Id Store DayOfWeek Date Open Promo StateHoliday SchoolHoliday
0 1 1 4 2015-09-17 1.0 1 0 0
1 2 3 4 2015-09-17 1.0 1 0 0
2 3 7 4 2015-09-17 1.0 1 0 0
3 4 8 4 2015-09-17 1.0 1 0 0
4 5 9 4 2015-09-17 1.0 1 0 0
... ... ... ... ... ... ... ... ...
41083 41084 1111 6 2015-08-01 1.0 0 0 0
41084 41085 1112 6 2015-08-01 1.0 0 0 0
41085 41086 1113 6 2015-08-01 1.0 0 0 0
41086 41087 1114 6 2015-08-01 1.0 0 0 0
41087 41088 1115 6 2015-08-01 1.0 0 0 1

41088 rows × 8 columns

store_df
Store StoreType Assortment CompetitionDistance CompetitionOpenSinceMonth CompetitionOpenSinceYear Promo2 Promo2SinceWeek Promo2SinceYear PromoInterval
0 1 c a 1270.0 9.0 2008.0 0 NaN NaN NaN
1 2 a a 570.0 11.0 2007.0 1 13.0 2010.0 Jan,Apr,Jul,Oct
2 3 a a 14130.0 12.0 2006.0 1 14.0 2011.0 Jan,Apr,Jul,Oct
3 4 c c 620.0 9.0 2009.0 0 NaN NaN NaN
4 5 a a 29910.0 4.0 2015.0 0 NaN NaN NaN
... ... ... ... ... ... ... ... ... ... ...
1110 1111 a a 1900.0 6.0 2014.0 1 31.0 2013.0 Jan,Apr,Jul,Oct
1111 1112 c c 1880.0 4.0 2006.0 0 NaN NaN NaN
1112 1113 a c 9260.0 NaN NaN 0 NaN NaN NaN
1113 1114 a c 870.0 NaN NaN 0 NaN NaN NaN
1114 1115 d c 5350.0 NaN NaN 1 22.0 2012.0 Mar,Jun,Sept,Dec

1115 rows × 10 columns

merged_df = ross_df.merge(store_df, how='left', on='Store')
merged_test_df = test_df.merge(store_df, how='left', on='Store')
merged_df
Store DayOfWeek Date Sales Customers Open Promo StateHoliday SchoolHoliday StoreType Assortment CompetitionDistance CompetitionOpenSinceMonth CompetitionOpenSinceYear Promo2 Promo2SinceWeek Promo2SinceYear PromoInterval
0 1 5 2015-07-31 5263 555 1 1 0 1 c a 1270.0 9.0 2008.0 0 NaN NaN NaN
1 2 5 2015-07-31 6064 625 1 1 0 1 a a 570.0 11.0 2007.0 1 13.0 2010.0 Jan,Apr,Jul,Oct
2 3 5 2015-07-31 8314 821 1 1 0 1 a a 14130.0 12.0 2006.0 1 14.0 2011.0 Jan,Apr,Jul,Oct
3 4 5 2015-07-31 13995 1498 1 1 0 1 c c 620.0 9.0 2009.0 0 NaN NaN NaN
4 5 5 2015-07-31 4822 559 1 1 0 1 a a 29910.0 4.0 2015.0 0 NaN NaN NaN
... ... ... ... ... ... ... ... ... ... ... ... ... ... ... ... ... ... ...
1017204 1111 2 2013-01-01 0 0 0 0 a 1 a a 1900.0 6.0 2014.0 1 31.0 2013.0 Jan,Apr,Jul,Oct
1017205 1112 2 2013-01-01 0 0 0 0 a 1 c c 1880.0 4.0 2006.0 0 NaN NaN NaN
1017206 1113 2 2013-01-01 0 0 0 0 a 1 a c 9260.0 NaN NaN 0 NaN NaN NaN
1017207 1114 2 2013-01-01 0 0 0 0 a 1 a c 870.0 NaN NaN 0 NaN NaN NaN
1017208 1115 2 2013-01-01 0 0 0 0 a 1 d c 5350.0 NaN NaN 1 22.0 2012.0 Mar,Jun,Sept,Dec

1017209 rows × 18 columns

Exploratory Data Analysis

Preprocessing and Feature Engineering

merged_df.info()
<class 'pandas.core.frame.DataFrame'>
Int64Index: 1017209 entries, 0 to 1017208
Data columns (total 18 columns):
 #   Column                     Non-Null Count    Dtype  
---  ------                     --------------    -----  
 0   Store                      1017209 non-null  int64  
 1   DayOfWeek                  1017209 non-null  int64  
 2   Date                       1017209 non-null  object 
 3   Sales                      1017209 non-null  int64  
 4   Customers                  1017209 non-null  int64  
 5   Open                       1017209 non-null  int64  
 6   Promo                      1017209 non-null  int64  
 7   StateHoliday               1017209 non-null  object 
 8   SchoolHoliday              1017209 non-null  int64  
 9   StoreType                  1017209 non-null  object 
 10  Assortment                 1017209 non-null  object 
 11  CompetitionDistance        1014567 non-null  float64
 12  CompetitionOpenSinceMonth  693861 non-null   float64
 13  CompetitionOpenSinceYear   693861 non-null   float64
 14  Promo2                     1017209 non-null  int64  
 15  Promo2SinceWeek            509178 non-null   float64
 16  Promo2SinceYear            509178 non-null   float64
 17  PromoInterval              509178 non-null   object 
dtypes: float64(5), int64(8), object(5)
memory usage: 147.5+ MB

Date

def split_date(df):
    df['Date'] = pd.to_datetime(df['Date'])
    df['Year'] = df.Date.dt.year
    df['Month'] = df.Date.dt.month
    df['Day'] = df.Date.dt.day
    df['WeekofYear'] = df.Date.dt.isocalendar().week
split_date(merged_df)
split_date(merged_test_df)
merged_df
Store DayOfWeek Date Sales Customers Open Promo StateHoliday SchoolHoliday StoreType Assortment CompetitionDistance CompetitionOpenSinceMonth CompetitionOpenSinceYear Promo2 Promo2SinceWeek Promo2SinceYear PromoInterval Year Month Day WeekofYear
0 1 5 2015-07-31 5263 555 1 1 0 1 c a 1270.0 9.0 2008.0 0 NaN NaN NaN 2015 7 31 31
1 2 5 2015-07-31 6064 625 1 1 0 1 a a 570.0 11.0 2007.0 1 13.0 2010.0 Jan,Apr,Jul,Oct 2015 7 31 31
2 3 5 2015-07-31 8314 821 1 1 0 1 a a 14130.0 12.0 2006.0 1 14.0 2011.0 Jan,Apr,Jul,Oct 2015 7 31 31
3 4 5 2015-07-31 13995 1498 1 1 0 1 c c 620.0 9.0 2009.0 0 NaN NaN NaN 2015 7 31 31
4 5 5 2015-07-31 4822 559 1 1 0 1 a a 29910.0 4.0 2015.0 0 NaN NaN NaN 2015 7 31 31
... ... ... ... ... ... ... ... ... ... ... ... ... ... ... ... ... ... ... ... ... ... ...
1017204 1111 2 2013-01-01 0 0 0 0 a 1 a a 1900.0 6.0 2014.0 1 31.0 2013.0 Jan,Apr,Jul,Oct 2013 1 1 1
1017205 1112 2 2013-01-01 0 0 0 0 a 1 c c 1880.0 4.0 2006.0 0 NaN NaN NaN 2013 1 1 1
1017206 1113 2 2013-01-01 0 0 0 0 a 1 a c 9260.0 NaN NaN 0 NaN NaN NaN 2013 1 1 1
1017207 1114 2 2013-01-01 0 0 0 0 a 1 a c 870.0 NaN NaN 0 NaN NaN NaN 2013 1 1 1
1017208 1115 2 2013-01-01 0 0 0 0 a 1 d c 5350.0 NaN NaN 1 22.0 2012.0 Mar,Jun,Sept,Dec 2013 1 1 1

1017209 rows × 22 columns

Store Open/Closed

merged_df[merged_df.Open ==0].Sales.value_counts()
0    172817
Name: Sales, dtype: int64

Instead of trying to model this relationship, it would be better to hard-code it in our predictions, and remove the rows where the store is closed. We won't remove any rows from the test set, since we need to make predictions for every row.

merged_df = merged_df[merged_df.Open == 1].copy()

Competition

merged_df.sample(10)
Store DayOfWeek Date Sales Customers Open Promo StateHoliday SchoolHoliday StoreType Assortment CompetitionDistance CompetitionOpenSinceMonth CompetitionOpenSinceYear Promo2 Promo2SinceWeek Promo2SinceYear PromoInterval Year Month Day WeekofYear
81229 950 3 2015-05-20 6709 619 1 1 0 0 a a 8460.0 11.0 1994.0 0 NaN NaN NaN 2015 5 20 21
3394 50 2 2015-07-28 5115 390 1 1 0 1 d a 6260.0 11.0 2009.0 0 NaN NaN NaN 2015 7 28 31
157691 477 4 2015-03-12 5154 394 1 0 0 0 d a 770.0 7.0 2010.0 1 35.0 2010.0 Jan,Apr,Jul,Oct 2015 3 12 11
1013035 286 5 2013-01-04 4505 442 1 0 0 1 a a 1460.0 4.0 2015.0 0 NaN NaN NaN 2013 1 4 1
366973 757 4 2014-08-14 4553 465 1 0 0 1 a c 3450.0 NaN NaN 0 NaN NaN NaN 2014 8 14 33
40863 724 4 2015-06-25 5821 635 1 0 0 0 d c 5900.0 NaN NaN 0 NaN NaN NaN 2015 6 25 26
416853 629 1 2014-06-23 7655 637 1 0 0 0 d a 510.0 7.0 2014.0 1 23.0 2015.0 Mar,Jun,Sept,Dec 2014 6 23 26
213001 37 3 2015-01-21 4175 535 1 0 0 0 c a 4230.0 12.0 2014.0 0 NaN NaN NaN 2015 1 21 4
228007 548 4 2015-01-08 4576 359 1 1 0 1 d c 3760.0 2.0 2009.0 0 NaN NaN NaN 2015 1 8 2
59667 573 1 2015-06-08 3584 310 1 0 0 0 a a 1190.0 11.0 2012.0 1 36.0 2013.0 Jan,Apr,Jul,Oct 2015 6 8 24

we can use the columns CompetitionOpenSince[Month/Year] columns from store_df to compute the number of months for which a competitor has been open near the store.

def comp_months(df):
    df['CompetitionOpen'] = 12 * (df.Year - df.CompetitionOpenSinceYear) + (df.Month - df.CompetitionOpenSinceMonth)
    df['CompetitionOpen'] = df['CompetitionOpen'].map(lambda x: 0 if x < 0 else x).fillna(0)
comp_months(merged_df)
comp_months(merged_test_df)
merged_df.head(10)
Store DayOfWeek Date Sales Customers Open Promo StateHoliday SchoolHoliday StoreType Assortment CompetitionDistance CompetitionOpenSinceMonth CompetitionOpenSinceYear Promo2 Promo2SinceWeek Promo2SinceYear PromoInterval Year Month Day WeekofYear CompetitionOpen
0 1 5 2015-07-31 5263 555 1 1 0 1 c a 1270.0 9.0 2008.0 0 NaN NaN NaN 2015 7 31 31 82.0
1 2 5 2015-07-31 6064 625 1 1 0 1 a a 570.0 11.0 2007.0 1 13.0 2010.0 Jan,Apr,Jul,Oct 2015 7 31 31 92.0
2 3 5 2015-07-31 8314 821 1 1 0 1 a a 14130.0 12.0 2006.0 1 14.0 2011.0 Jan,Apr,Jul,Oct 2015 7 31 31 103.0
3 4 5 2015-07-31 13995 1498 1 1 0 1 c c 620.0 9.0 2009.0 0 NaN NaN NaN 2015 7 31 31 70.0
4 5 5 2015-07-31 4822 559 1 1 0 1 a a 29910.0 4.0 2015.0 0 NaN NaN NaN 2015 7 31 31 3.0
5 6 5 2015-07-31 5651 589 1 1 0 1 a a 310.0 12.0 2013.0 0 NaN NaN NaN 2015 7 31 31 19.0
6 7 5 2015-07-31 15344 1414 1 1 0 1 a c 24000.0 4.0 2013.0 0 NaN NaN NaN 2015 7 31 31 27.0
7 8 5 2015-07-31 8492 833 1 1 0 1 a a 7520.0 10.0 2014.0 0 NaN NaN NaN 2015 7 31 31 9.0
8 9 5 2015-07-31 8565 687 1 1 0 1 a c 2030.0 8.0 2000.0 0 NaN NaN NaN 2015 7 31 31 179.0
9 10 5 2015-07-31 7185 681 1 1 0 1 a a 3160.0 9.0 2009.0 0 NaN NaN NaN 2015 7 31 31 70.0
merged_df[['Date', 'CompetitionDistance', 'CompetitionOpenSinceYear', 'CompetitionOpenSinceMonth', 'CompetitionOpen']]
Date CompetitionDistance CompetitionOpenSinceYear CompetitionOpenSinceMonth CompetitionOpen
0 2015-07-31 1270.0 2008.0 9.0 82.0
1 2015-07-31 570.0 2007.0 11.0 92.0
2 2015-07-31 14130.0 2006.0 12.0 103.0
3 2015-07-31 620.0 2009.0 9.0 70.0
4 2015-07-31 29910.0 2015.0 4.0 3.0
... ... ... ... ... ...
1016776 2013-01-01 150.0 2006.0 9.0 76.0
1016827 2013-01-01 860.0 1999.0 10.0 159.0
1016863 2013-01-01 840.0 NaN NaN 0.0
1017042 2013-01-01 1430.0 NaN NaN 0.0
1017190 2013-01-01 720.0 2002.0 3.0 130.0

844392 rows × 5 columns

Additional Promotion

merged_df
Store DayOfWeek Date Sales Customers Open Promo StateHoliday SchoolHoliday StoreType Assortment CompetitionDistance CompetitionOpenSinceMonth CompetitionOpenSinceYear Promo2 Promo2SinceWeek Promo2SinceYear PromoInterval Year Month Day WeekofYear CompetitionOpen
0 1 5 2015-07-31 5263 555 1 1 0 1 c a 1270.0 9.0 2008.0 0 NaN NaN NaN 2015 7 31 31 82.0
1 2 5 2015-07-31 6064 625 1 1 0 1 a a 570.0 11.0 2007.0 1 13.0 2010.0 Jan,Apr,Jul,Oct 2015 7 31 31 92.0
2 3 5 2015-07-31 8314 821 1 1 0 1 a a 14130.0 12.0 2006.0 1 14.0 2011.0 Jan,Apr,Jul,Oct 2015 7 31 31 103.0
3 4 5 2015-07-31 13995 1498 1 1 0 1 c c 620.0 9.0 2009.0 0 NaN NaN NaN 2015 7 31 31 70.0
4 5 5 2015-07-31 4822 559 1 1 0 1 a a 29910.0 4.0 2015.0 0 NaN NaN NaN 2015 7 31 31 3.0
... ... ... ... ... ... ... ... ... ... ... ... ... ... ... ... ... ... ... ... ... ... ... ...
1016776 682 2 2013-01-01 3375 566 1 0 a 1 b a 150.0 9.0 2006.0 0 NaN NaN NaN 2013 1 1 1 76.0
1016827 733 2 2013-01-01 10765 2377 1 0 a 1 b b 860.0 10.0 1999.0 0 NaN NaN NaN 2013 1 1 1 159.0
1016863 769 2 2013-01-01 5035 1248 1 0 a 1 b b 840.0 NaN NaN 1 48.0 2012.0 Jan,Apr,Jul,Oct 2013 1 1 1 0.0
1017042 948 2 2013-01-01 4491 1039 1 0 a 1 b b 1430.0 NaN NaN 0 NaN NaN NaN 2013 1 1 1 0.0
1017190 1097 2 2013-01-01 5961 1405 1 0 a 1 b b 720.0 3.0 2002.0 0 NaN NaN NaN 2013 1 1 1 130.0

844392 rows × 23 columns

add some additional columns to indicate how long a store has been running Promo2 and whether a new round of Promo2 starts in the current month.

def check_promo_month(row):
    month2str = {1:'Jan', 2:'Feb', 3:'Mar', 4:'Apr', 5:'May', 6:'Jun',              
                 7:'Jul', 8:'Aug', 9:'Sept', 10:'Oct', 11:'Nov', 12:'Dec'}
    
    try:
        months = (row['PromoInterval'] or '').split(',')
        if row['Promo2Open'] and month2str[row['Month']] in months:
            return -1
        else:
            return 0
        
    except Exception:
        return 0
    
    
def promo_cols(df):
    # month since Promo2 was open
    df['Promo2Open'] = 12 * (df.Year-df.Promo2SinceYear) + (df.WeekofYear - df.Promo2SinceWeek) * 7/30.5
    df['Promo2Open'] = df['Promo2Open'] .map(lambda x: 0 if x < 0 else x).fillna(0) * df['Promo2']
    
    #wether a new round of promotions was started in the current month
    df['IsPromo2Month'] = df.apply(check_promo_month, axis=1) * df['Promo2']
promo_cols(merged_df)
promo_cols(merged_test_df)

merged_df
Store DayOfWeek Date Sales Customers Open Promo StateHoliday SchoolHoliday StoreType Assortment CompetitionDistance CompetitionOpenSinceMonth CompetitionOpenSinceYear Promo2 Promo2SinceWeek Promo2SinceYear PromoInterval Year Month Day WeekofYear CompetitionOpen Promo2Open IsPromo2Month
0 1 5 2015-07-31 5263 555 1 1 0 1 c a 1270.0 9.0 2008.0 0 NaN NaN NaN 2015 7 31 31 82.0 0.000000 0
1 2 5 2015-07-31 6064 625 1 1 0 1 a a 570.0 11.0 2007.0 1 13.0 2010.0 Jan,Apr,Jul,Oct 2015 7 31 31 92.0 64.131148 -1
2 3 5 2015-07-31 8314 821 1 1 0 1 a a 14130.0 12.0 2006.0 1 14.0 2011.0 Jan,Apr,Jul,Oct 2015 7 31 31 103.0 51.901639 -1
3 4 5 2015-07-31 13995 1498 1 1 0 1 c c 620.0 9.0 2009.0 0 NaN NaN NaN 2015 7 31 31 70.0 0.000000 0
4 5 5 2015-07-31 4822 559 1 1 0 1 a a 29910.0 4.0 2015.0 0 NaN NaN NaN 2015 7 31 31 3.0 0.000000 0
... ... ... ... ... ... ... ... ... ... ... ... ... ... ... ... ... ... ... ... ... ... ... ... ... ...
1016776 682 2 2013-01-01 3375 566 1 0 a 1 b a 150.0 9.0 2006.0 0 NaN NaN NaN 2013 1 1 1 76.0 0.000000 0
1016827 733 2 2013-01-01 10765 2377 1 0 a 1 b b 860.0 10.0 1999.0 0 NaN NaN NaN 2013 1 1 1 159.0 0.000000 0
1016863 769 2 2013-01-01 5035 1248 1 0 a 1 b b 840.0 NaN NaN 1 48.0 2012.0 Jan,Apr,Jul,Oct 2013 1 1 1 0.0 1.213115 -1
1017042 948 2 2013-01-01 4491 1039 1 0 a 1 b b 1430.0 NaN NaN 0 NaN NaN NaN 2013 1 1 1 0.0 0.000000 0
1017190 1097 2 2013-01-01 5961 1405 1 0 a 1 b b 720.0 3.0 2002.0 0 NaN NaN NaN 2013 1 1 1 130.0 0.000000 0

844392 rows × 25 columns

merged_df[['Date', 'Promo2', 'Promo2SinceYear', 'Promo2SinceWeek', 'PromoInterval', 'Promo2Open', 'IsPromo2Month']].sample(20)
Date Promo2 Promo2SinceYear Promo2SinceWeek PromoInterval Promo2Open IsPromo2Month
778123 2013-08-03 0 NaN NaN NaN 0.000000 0
485713 2014-04-22 0 NaN NaN NaN 0.000000 0
212896 2015-01-22 1 2009.0 45.0 Feb,May,Aug,Nov 62.590164 0
998575 2013-01-17 1 2014.0 10.0 Mar,Jun,Sept,Dec 0.000000 0
408579 2014-06-30 0 NaN NaN NaN 0.000000 0
891338 2013-04-23 0 NaN NaN NaN 0.000000 0
884400 2013-04-30 0 NaN NaN NaN 0.000000 0
892016 2013-04-23 1 2011.0 22.0 Feb,May,Aug,Nov 22.852459 0
645306 2013-11-30 1 2009.0 37.0 Jan,Apr,Jul,Oct 50.524590 0
429670 2014-06-11 1 2009.0 37.0 Jan,Apr,Jul,Oct 57.016393 0
989989 2013-01-25 1 2013.0 5.0 Feb,May,Aug,Nov 0.000000 0
110965 2015-04-23 0 NaN NaN NaN 0.000000 0
723857 2013-09-21 0 NaN NaN NaN 0.000000 0
445329 2014-05-28 1 2014.0 40.0 Jan,Apr,Jul,Oct 0.000000 0
1298 2015-07-30 0 NaN NaN NaN 0.000000 0
575426 2014-02-01 1 2015.0 23.0 Mar,Jun,Sept,Dec 0.000000 0
232178 2015-01-04 0 NaN NaN NaN 0.000000 0
196856 2015-02-05 1 2011.0 9.0 Jan,Apr,Jul,Oct 47.311475 0
926871 2013-03-23 1 2014.0 40.0 Jan,Apr,Jul,Oct 0.000000 0
950895 2013-03-01 0 NaN NaN NaN 0.000000 0
merged_df
Store DayOfWeek Date Sales Customers Open Promo StateHoliday SchoolHoliday StoreType Assortment CompetitionDistance CompetitionOpenSinceMonth CompetitionOpenSinceYear Promo2 Promo2SinceWeek Promo2SinceYear PromoInterval Year Month Day WeekofYear CompetitionOpen Promo2Open IsPromo2Month
0 1 5 2015-07-31 5263 555 1 1 0 1 c a 1270.0 9.0 2008.0 0 NaN NaN NaN 2015 7 31 31 82.0 0.000000 0
1 2 5 2015-07-31 6064 625 1 1 0 1 a a 570.0 11.0 2007.0 1 13.0 2010.0 Jan,Apr,Jul,Oct 2015 7 31 31 92.0 64.131148 -1
2 3 5 2015-07-31 8314 821 1 1 0 1 a a 14130.0 12.0 2006.0 1 14.0 2011.0 Jan,Apr,Jul,Oct 2015 7 31 31 103.0 51.901639 -1
3 4 5 2015-07-31 13995 1498 1 1 0 1 c c 620.0 9.0 2009.0 0 NaN NaN NaN 2015 7 31 31 70.0 0.000000 0
4 5 5 2015-07-31 4822 559 1 1 0 1 a a 29910.0 4.0 2015.0 0 NaN NaN NaN 2015 7 31 31 3.0 0.000000 0
... ... ... ... ... ... ... ... ... ... ... ... ... ... ... ... ... ... ... ... ... ... ... ... ... ...
1016776 682 2 2013-01-01 3375 566 1 0 a 1 b a 150.0 9.0 2006.0 0 NaN NaN NaN 2013 1 1 1 76.0 0.000000 0
1016827 733 2 2013-01-01 10765 2377 1 0 a 1 b b 860.0 10.0 1999.0 0 NaN NaN NaN 2013 1 1 1 159.0 0.000000 0
1016863 769 2 2013-01-01 5035 1248 1 0 a 1 b b 840.0 NaN NaN 1 48.0 2012.0 Jan,Apr,Jul,Oct 2013 1 1 1 0.0 1.213115 -1
1017042 948 2 2013-01-01 4491 1039 1 0 a 1 b b 1430.0 NaN NaN 0 NaN NaN NaN 2013 1 1 1 0.0 0.000000 0
1017190 1097 2 2013-01-01 5961 1405 1 0 a 1 b b 720.0 3.0 2002.0 0 NaN NaN NaN 2013 1 1 1 130.0 0.000000 0

844392 rows × 25 columns

Input and Target Columns

merged_df.columns
Index(['Store', 'DayOfWeek', 'Date', 'Sales', 'Customers', 'Open', 'Promo',
       'StateHoliday', 'SchoolHoliday', 'StoreType', 'Assortment',
       'CompetitionDistance', 'CompetitionOpenSinceMonth',
       'CompetitionOpenSinceYear', 'Promo2', 'Promo2SinceWeek',
       'Promo2SinceYear', 'PromoInterval', 'Year', 'Month', 'Day',
       'WeekofYear', 'CompetitionOpen', 'Promo2Open', 'IsPromo2Month'],
      dtype='object')
input_cols = ['Store', 'DayOfWeek', 'Promo', 'StateHoliday', 'SchoolHoliday', 
              'StoreType', 'Assortment', 'CompetitionDistance', 'CompetitionOpen', 
              'Day', 'Month', 'Year', 'WeekofYear',  'Promo2', 
              'Promo2Open', 'IsPromo2Month']
target_col = 'Sales'
inputs = merged_df[input_cols].copy()
targets = merged_df[target_col].copy()
test_inputs = merged_test_df[input_cols].copy()
inputs
Store DayOfWeek Promo StateHoliday SchoolHoliday StoreType Assortment CompetitionDistance CompetitionOpen Day Month Year WeekofYear Promo2 Promo2Open IsPromo2Month
0 1 5 1 0 1 c a 1270.0 82.0 31 7 2015 31 0 0.000000 0
1 2 5 1 0 1 a a 570.0 92.0 31 7 2015 31 1 64.131148 -1
2 3 5 1 0 1 a a 14130.0 103.0 31 7 2015 31 1 51.901639 -1
3 4 5 1 0 1 c c 620.0 70.0 31 7 2015 31 0 0.000000 0
4 5 5 1 0 1 a a 29910.0 3.0 31 7 2015 31 0 0.000000 0
... ... ... ... ... ... ... ... ... ... ... ... ... ... ... ... ...
1016776 682 2 0 a 1 b a 150.0 76.0 1 1 2013 1 0 0.000000 0
1016827 733 2 0 a 1 b b 860.0 159.0 1 1 2013 1 0 0.000000 0
1016863 769 2 0 a 1 b b 840.0 0.0 1 1 2013 1 1 1.213115 -1
1017042 948 2 0 a 1 b b 1430.0 0.0 1 1 2013 1 0 0.000000 0
1017190 1097 2 0 a 1 b b 720.0 130.0 1 1 2013 1 0 0.000000 0

844392 rows × 16 columns

numeric_cols = ['Store', 'Promo', 'SchoolHoliday', 'CompetitionDistance',
                'CompetitionOpen', 'Promo2', 'Promo2Open', 'IsPromo2Month',
                'Day', 'Month', 'Year', 'WeekofYear']

categorical_cols = ['DayOfWeek', 'StateHoliday', 'StoreType', 'Assortment']

Impute missing Numrical Data

inputs[numeric_cols].isna().sum()
Store                     0
Promo                     0
SchoolHoliday             0
CompetitionDistance    2186
CompetitionOpen           0
Promo2                    0
Promo2Open                0
IsPromo2Month             0
Day                       0
Month                     0
Year                      0
WeekofYear                0
dtype: int64
test_inputs[numeric_cols].isna().sum()
Store                   0
Promo                   0
SchoolHoliday           0
CompetitionDistance    96
CompetitionOpen         0
Promo2                  0
Promo2Open              0
IsPromo2Month           0
Day                     0
Month                   0
Year                    0
WeekofYear              0
dtype: int64

Seems like competition distance is the only missing value, and we can simply fill it with the highest value (to indicate that competition is very far away).

max_distance = inputs.CompetitionDistance.max()
max_distance
75860.0
inputs['CompetitionDistance'].fillna(max_distance*2, inplace=True)
test_inputs['CompetitionDistance'].fillna(max_distance*2, inplace=True)

Scale Numeric Value

from sklearn.preprocessing import MinMaxScaler
scaler = MinMaxScaler().fit(inputs[numeric_cols])
inputs[numeric_cols] = scaler.transform(inputs[numeric_cols])
test_inputs[numeric_cols] = scaler.transform(test_inputs[numeric_cols])
inputs[numeric_cols].head(10)
Store Promo SchoolHoliday CompetitionDistance CompetitionOpen Promo2 Promo2Open IsPromo2Month Day Month Year WeekofYear
0 0.000000 1.0 1.0 0.008240 0.059163 0.0 0.000000 1.0 1.0 0.545455 1.0 0.588235
1 0.000898 1.0 1.0 0.003626 0.066378 1.0 0.890710 0.0 1.0 0.545455 1.0 0.588235
2 0.001795 1.0 1.0 0.093013 0.074315 1.0 0.720856 0.0 1.0 0.545455 1.0 0.588235
3 0.002693 1.0 1.0 0.003955 0.050505 0.0 0.000000 1.0 1.0 0.545455 1.0 0.588235
4 0.003591 1.0 1.0 0.197034 0.002165 0.0 0.000000 1.0 1.0 0.545455 1.0 0.588235
5 0.004488 1.0 1.0 0.001912 0.013709 0.0 0.000000 1.0 1.0 0.545455 1.0 0.588235
6 0.005386 1.0 1.0 0.158075 0.019481 0.0 0.000000 1.0 1.0 0.545455 1.0 0.588235
7 0.006284 1.0 1.0 0.049440 0.006494 0.0 0.000000 1.0 1.0 0.545455 1.0 0.588235
8 0.007181 1.0 1.0 0.013250 0.129149 0.0 0.000000 1.0 1.0 0.545455 1.0 0.588235
9 0.008079 1.0 1.0 0.020699 0.050505 0.0 0.000000 1.0 1.0 0.545455 1.0 0.588235

Encode Categorical Columns

from sklearn.preprocessing import OneHotEncoder
encoder = OneHotEncoder(sparse=False, handle_unknown='ignore').fit(inputs[categorical_cols])
encoded_cols = list(encoder.get_feature_names(categorical_cols))
inputs[encoded_cols] = encoder.transform(inputs[categorical_cols])
test_inputs[encoded_cols] = encoder.transform(test_inputs[categorical_cols])
encoded_cols
['DayOfWeek_1',
 'DayOfWeek_2',
 'DayOfWeek_3',
 'DayOfWeek_4',
 'DayOfWeek_5',
 'DayOfWeek_6',
 'DayOfWeek_7',
 'StateHoliday_0',
 'StateHoliday_a',
 'StateHoliday_b',
 'StateHoliday_c',
 'StoreType_a',
 'StoreType_b',
 'StoreType_c',
 'StoreType_d',
 'Assortment_a',
 'Assortment_b',
 'Assortment_c']
X = inputs[numeric_cols + encoded_cols]
X_test = test_inputs[numeric_cols + encoded_cols]
X.head(10)
Store Promo SchoolHoliday CompetitionDistance CompetitionOpen Promo2 Promo2Open IsPromo2Month Day Month Year WeekofYear DayOfWeek_1 DayOfWeek_2 DayOfWeek_3 DayOfWeek_4 DayOfWeek_5 DayOfWeek_6 DayOfWeek_7 StateHoliday_0 StateHoliday_a StateHoliday_b StateHoliday_c StoreType_a StoreType_b StoreType_c StoreType_d Assortment_a Assortment_b Assortment_c
0 0.000000 1.0 1.0 0.008240 0.059163 0.0 0.000000 1.0 1.0 0.545455 1.0 0.588235 0.0 0.0 0.0 0.0 1.0 0.0 0.0 1.0 0.0 0.0 0.0 0.0 0.0 1.0 0.0 1.0 0.0 0.0
1 0.000898 1.0 1.0 0.003626 0.066378 1.0 0.890710 0.0 1.0 0.545455 1.0 0.588235 0.0 0.0 0.0 0.0 1.0 0.0 0.0 1.0 0.0 0.0 0.0 1.0 0.0 0.0 0.0 1.0 0.0 0.0
2 0.001795 1.0 1.0 0.093013 0.074315 1.0 0.720856 0.0 1.0 0.545455 1.0 0.588235 0.0 0.0 0.0 0.0 1.0 0.0 0.0 1.0 0.0 0.0 0.0 1.0 0.0 0.0 0.0 1.0 0.0 0.0
3 0.002693 1.0 1.0 0.003955 0.050505 0.0 0.000000 1.0 1.0 0.545455 1.0 0.588235 0.0 0.0 0.0 0.0 1.0 0.0 0.0 1.0 0.0 0.0 0.0 0.0 0.0 1.0 0.0 0.0 0.0 1.0
4 0.003591 1.0 1.0 0.197034 0.002165 0.0 0.000000 1.0 1.0 0.545455 1.0 0.588235 0.0 0.0 0.0 0.0 1.0 0.0 0.0 1.0 0.0 0.0 0.0 1.0 0.0 0.0 0.0 1.0 0.0 0.0
5 0.004488 1.0 1.0 0.001912 0.013709 0.0 0.000000 1.0 1.0 0.545455 1.0 0.588235 0.0 0.0 0.0 0.0 1.0 0.0 0.0 1.0 0.0 0.0 0.0 1.0 0.0 0.0 0.0 1.0 0.0 0.0
6 0.005386 1.0 1.0 0.158075 0.019481 0.0 0.000000 1.0 1.0 0.545455 1.0 0.588235 0.0 0.0 0.0 0.0 1.0 0.0 0.0 1.0 0.0 0.0 0.0 1.0 0.0 0.0 0.0 0.0 0.0 1.0
7 0.006284 1.0 1.0 0.049440 0.006494 0.0 0.000000 1.0 1.0 0.545455 1.0 0.588235 0.0 0.0 0.0 0.0 1.0 0.0 0.0 1.0 0.0 0.0 0.0 1.0 0.0 0.0 0.0 1.0 0.0 0.0
8 0.007181 1.0 1.0 0.013250 0.129149 0.0 0.000000 1.0 1.0 0.545455 1.0 0.588235 0.0 0.0 0.0 0.0 1.0 0.0 0.0 1.0 0.0 0.0 0.0 1.0 0.0 0.0 0.0 0.0 0.0 1.0
9 0.008079 1.0 1.0 0.020699 0.050505 0.0 0.000000 1.0 1.0 0.545455 1.0 0.588235 0.0 0.0 0.0 0.0 1.0 0.0 0.0 1.0 0.0 0.0 0.0 1.0 0.0 0.0 0.0 1.0 0.0 0.0

Gradient Boosting

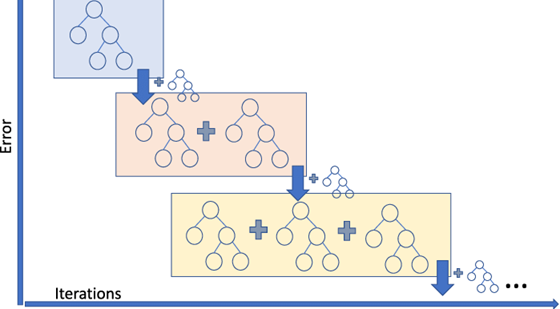
  1. The average value of the target column and uses as an initial prediction every input.
  2. The residuals (difference) of the predictions with the targets are computed.
  3. A decision tree of limited depth is trained to predict just the residuals for each input.
  4. Predictions from the decision tree are scaled using a parameter called the learning rate (this prevents overfitting)
  5. Scaled predictions fro the tree are added to the previous predictions to obtain the new and improved predictions.
  6. Steps 2 to 5 are repeated to create new decision trees, each of which is trained to predict just the residuals from the previous prediction.

The term "gradient" refers to the fact that each decision tree is trained with the purpose of reducing the loss from the previous iteration (similar to gradient descent). The term "boosting" refers the general technique of training new models to improve the results of an existing model.

For a mathematical explanation of gradient boosting, check out the following resources:

Here's a visual representation of gradient boosting:

Gradient Boosting Machines:GBMs

Traning

from xgboost import XGBRegressor
?XGBRegressor
model = XGBRegressor(random_state=42, n_jobs=-1, n_estimators=20, max_depth=4)

lets train model using model.fit

%%time
model.fit(X, targets)
CPU times: user 42.7 s, sys: 981 ms, total: 43.7 s
Wall time: 4.16 s
XGBRegressor(base_score=0.5, booster='gbtree', colsample_bylevel=1,
             colsample_bynode=1, colsample_bytree=1, gamma=0, gpu_id=-1,
             importance_type='gain', interaction_constraints='',
             learning_rate=0.300000012, max_delta_step=0, max_depth=4,
             min_child_weight=1, missing=nan, monotone_constraints='()',
             n_estimators=20, n_jobs=-1, num_parallel_tree=1, random_state=42,
             reg_alpha=0, reg_lambda=1, scale_pos_weight=1, subsample=1,
             tree_method='exact', validate_parameters=1, verbosity=None)

Prediction

preds = model.predict(X)
preds
array([ 8127.9404,  7606.919 ,  8525.857 , ...,  6412.8247,  9460.068 ,
       10302.145 ], dtype=float32)

Evaluation

from sklearn.metrics import mean_squared_error
def rmse(a, b):
    return mean_squared_error(a, b, squared=False)
rmse(preds, targets)
2377.752008804669
merged_df.Sales.min(), merged_df.Sales.max()
(0, 41551)
import matplotlib.pyplot as plt
%matplotlib inline
plt.hist(merged_df.Sales.sample(10000))
(array([3.640e+02, 4.017e+03, 3.639e+03, 1.357e+03, 3.930e+02, 1.420e+02,
        5.900e+01, 2.300e+01, 4.000e+00, 2.000e+00]),
 array([    0. ,  3002.6,  6005.2,  9007.8, 12010.4, 15013. , 18015.6,
        21018.2, 24020.8, 27023.4, 30026. ]),
 <BarContainer object of 10 artists>)

Visualization

from xgboost import plot_tree
from matplotlib.pylab import rcParams

rcParams['figure.figsize'] = 60,60
plot_tree(model, rankdir='LR', num_trees=0);
plot_tree(model, rankdir='LR', num_trees=1);
plot_tree(model, rankdir='LR', num_trees=19);
trees = model.get_booster().get_dump()
len(trees)
20
print(trees[0])
0:[Promo<0.5] yes=1,no=2,missing=1
	1:[StoreType_b<0.5] yes=3,no=4,missing=3
		3:[Assortment_a<0.5] yes=7,no=8,missing=7
			7:[CompetitionDistance<0.00220830599] yes=15,no=16,missing=15
				15:leaf=2309.51147
				16:leaf=1823.30444
			8:[WeekofYear<0.911764741] yes=17,no=18,missing=17
				17:leaf=1619.43994
				18:leaf=2002.44897
		4:[CompetitionDistance<0.00800922886] yes=9,no=10,missing=9
			9:[CompetitionDistance<0.00672379695] yes=19,no=20,missing=19
				19:leaf=2740.44067
				20:leaf=5576.85889
			10:[DayOfWeek_7<0.5] yes=21,no=22,missing=21
				21:leaf=1898.36487
				22:leaf=2961.08765
	2:[DayOfWeek_1<0.5] yes=5,no=6,missing=5
		5:[Month<0.954545498] yes=11,no=12,missing=11
			11:[StoreType_b<0.5] yes=23,no=24,missing=23
				23:leaf=2295.30566
				24:leaf=3294.27759
			12:[Day<0.333333343] yes=25,no=26,missing=25
				25:leaf=2754.58521
				26:leaf=3246.39014
		6:[Month<0.954545498] yes=13,no=14,missing=13
			13:[CompetitionDistance<0.00135135138] yes=27,no=28,missing=27
				27:leaf=3347.80688
				28:leaf=2839.39551
			14:[Day<0.25] yes=29,no=30,missing=29
				29:leaf=3400.54419
				30:leaf=4059.85938

Feature Importance

importance_df = pd.DataFrame({
    'feature': X.columns,
    'importance':model.feature_importances_
}).sort_values('importance', ascending=False)
importance_df.head(10)
feature importance
1 Promo 0.317473
24 StoreType_b 0.086472
12 DayOfWeek_1 0.082269
5 Promo2 0.063986
3 CompetitionDistance 0.045053
29 Assortment_c 0.040226
27 Assortment_a 0.038759
9 Month 0.038493
0 Store 0.038119
8 Day 0.033209
import seaborn as sns
plt.figure(figsize=(10, 6))
plt.title('Feature Importance')
sns.barplot(data=importance_df.head(10), x='importance', y='feature');

K Fold Cross Validation

kfold

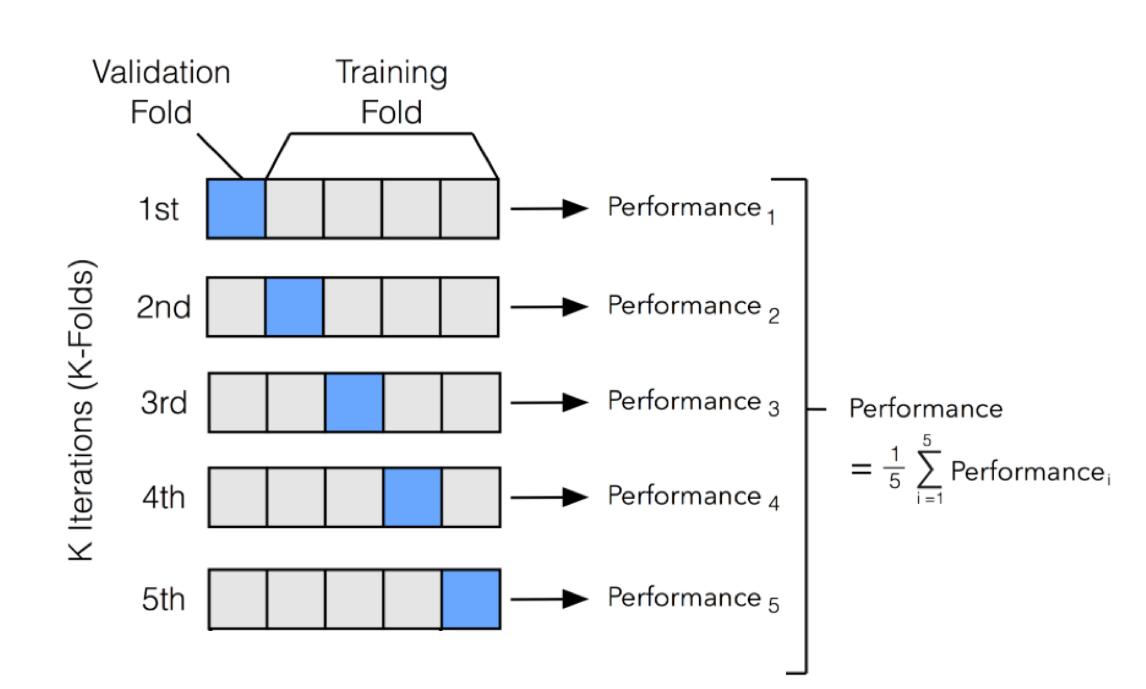
from sklearn.model_selection import KFold
def train_and_evaluate(X_train, train_targets, X_val, val_targets, **params):
    model = XGBRegressor(random_state=42, n_jobs=-1, **params)
    model.fit(X_train, train_targets)
    train_rmse = rmse(model.predict(X_train), train_targets)
    val_rmse = rmse(model.predict(X_val), val_targets)
    return model, train_rmse, val_rmse
    
kfold = KFold(n_splits=5)
models = []

for train_idxs, val_idxs in kfold.split(X):
    X_train, train_targets = X.iloc[train_idxs], targets.iloc[train_idxs]
    X_val, val_targets = X.iloc[val_idxs], targets.iloc[val_idxs]
    model, train_rmse, val_rmse = train_and_evaluate(X_train, 
                                                     train_targets, 
                                                     X_val, 
                                                     val_targets, 
                                                     max_depth=4, 
                                                     n_estimators=20)
    models.append(model)
    print('Train RMSE: {}, Validation RMSE: {}'.format(train_rmse, val_rmse))
Train RMSE: 2352.216448531526, Validation RMSE: 2424.6228916973314
Train RMSE: 2406.709513789309, Validation RMSE: 2451.9646038059277
Train RMSE: 2365.7354745443067, Validation RMSE: 2336.984157073758
Train RMSE: 2366.4732092777763, Validation RMSE: 2460.8995475901697
Train RMSE: 2379.3752997474626, Validation RMSE: 2440.665320626728
import numpy as np

def predict_avg(models, inputs):
    return np.mean([model.predict(inputs) for model in models], axis=0)
preds = predict_avg(models, X)
preds
array([8021.374 , 7577.715 , 8747.863 , ..., 7615.0303, 7924.784 ,
       9600.297 ], dtype=float32)

Hyperparameter Tuning and Regularization

Just like other machine learning models, there are several hyperparameters we can to adjust the capacity of model and reduce overfitting.

hpt

Check out the following resources to learn more about hyperparameter supported by XGBoost:

model
XGBRegressor(base_score=0.5, booster='gbtree', colsample_bylevel=1,
             colsample_bynode=1, colsample_bytree=1, gamma=0, gpu_id=-1,
             importance_type='gain', interaction_constraints='',
             learning_rate=0.300000012, max_delta_step=0, max_depth=4,
             min_child_weight=1, missing=nan, monotone_constraints='()',
             n_estimators=20, n_jobs=-1, num_parallel_tree=1, random_state=42,
             reg_alpha=0, reg_lambda=1, scale_pos_weight=1, subsample=1,
             tree_method='exact', validate_parameters=1, verbosity=None)
def test_params_kfold(n_splits, **params):
    train_rmses, val_rmses, models = [], [], []
    kfold = KFold(n_splits)
    for train_idxs, val_idxs in kfold.split(X):
        X_train, train_targets = X.iloc[train_idxs], targets.iloc[train_idxs]
        X_val, val_targets = X.iloc[val_idxs], targets.iloc[val_idxs]
        model, train_rmse, val_rmse = train_and_evaluate(X_train, train_targets, X_val, val_targets, **params)
        models.append(model)
        train_rmses.append(train_rmse)
        val_rmses.append(val_rmse)
    print('Train RMSE: {}, Validation RMSE: {}'.format(np.mean(train_rmses), np.mean(val_rmses)))
    return models
from sklearn.model_selection import train_test_split
X_train, X_val, train_targets, val_targets = train_test_split(X, targets, test_size=0.1)
def test_params(**params):
    model = XGBRegressor(n_jobs=-1, random_state=42, **params)
    model.fit(X_train, train_targets)
    train_rmse = rmse(model.predict(X_train), train_targets)
    val_rmse = rmse(model.predict(X_val), val_targets)
    print('Train RMSE: {}, Validation RMSE: {}'.format(train_rmse, val_rmse))

n_estimators

test_params(n_estimators=10)
Train RMSE: 2362.76195480308, Validation RMSE: 2348.702085349391
test_params(n_estimators=30)
Train RMSE: 1848.646131664556, Validation RMSE: 1839.8374140100673
test_params(n_estimators=100)
Train RMSE: 1189.0907835721493, Validation RMSE: 1182.191673835398
test_params(n_estimators=240)
Train RMSE: 900.8147134992857, Validation RMSE: 909.3936493978623

max_depth

test_params(max_depth=2)
Train RMSE: 2337.546637614515, Validation RMSE: 2315.858142292135
test_params(max_depth=5)
Train RMSE: 1420.072022973741, Validation RMSE: 1411.0540606302004
test_params(max_depth=10)
Train RMSE: 687.2499006884119, Validation RMSE: 775.8096745259544

learning_rate

test_params(n_estimators=50, learning_rate=0.01)
Train RMSE: 5044.48850172585, Validation RMSE: 5036.89440315394
test_params(n_estimators=50, learning_rate=0.1)
Train RMSE: 2200.172003242853, Validation RMSE: 2183.102936809057
test_params(n_estimators=50, learning_rate=0.3)
Train RMSE: 1541.0745464792515, Validation RMSE: 1529.8196486972695
test_params(n_estimators=50, learning_rate=0.9)
Train RMSE: 1121.9325695263058, Validation RMSE: 1123.541189011288

Booster

test_params(booster='gblinear')
Train RMSE: 2730.688924077907, Validation RMSE: 2707.009329528743

Putting it Together and Making Predictions

model = XGBRegressor(n_jobs=-1, random_state=42, n_estimators=1000, 
                     learning_rate=0.2, max_depth=10, subsample=0.9, 
                     colsample_bytree=0.7)
%%time
model.fit(X, targets)
CPU times: user 1h 6min 23s, sys: 13.4 s, total: 1h 6min 36s
Wall time: 5min 49s
XGBRegressor(base_score=0.5, booster='gbtree', colsample_bylevel=1,
             colsample_bynode=1, colsample_bytree=0.7, gamma=0, gpu_id=-1,
             importance_type='gain', interaction_constraints='',
             learning_rate=0.2, max_delta_step=0, max_depth=10,
             min_child_weight=1, missing=nan, monotone_constraints='()',
             n_estimators=1000, n_jobs=-1, num_parallel_tree=1, random_state=42,
             reg_alpha=0, reg_lambda=1, scale_pos_weight=1, subsample=0.9,
             tree_method='exact', validate_parameters=1, verbosity=None)
test_preds = model.predict(X_test)
submission_df['Sales']  = test_preds
test_df.Open.isna().sum()
11
submission_df['Sales'] = submission_df['Sales'] * test_df.Open.fillna(1.)
submission_df
Id Sales
0 1 3978.170898
1 2 7715.094727
2 3 8728.141602
3 4 7502.937012
4 5 7036.492676
... ... ...
41083 41084 2987.847168
41084 41085 6813.018066
41085 41086 6863.016602
41086 41087 23361.136719
41087 41088 6743.966797

41088 rows × 2 columns

submission_df.to_csv('submission.csv', index=None)